library(tidyverse)
library(gganimate)
library(lubridate)Animating plots using gganimate


Storms Data
The storms dataset from the dplyr package. This dataset tracks tropical storms in the North Atlantic, including wind speed, pressure, and location over time — making it perfect for animation.
data("storms")name: storm nameyear,month,day,hour: timestamp infolat,long: geographic locationwind: wind speed (in knots)pressure: atmospheric pressure (hPa)status: classification (tropical storm, hurricane, etc.)
Let’s animate the path of one specific storm – Katrina in 2005.
Let’s get the data in an appropriate format.
katrina <- storms %>%
filter(name == "Katrina", year == 2005) %>%
mutate(time = make_datetime(year, month, day, hour))It’s usually useful to start with a static plot:
ggplot(katrina, aes(x = long, y = lat)) +
geom_path(color = "gray") +
geom_point(aes(size = wind, color = pressure), alpha = 0.8) +
coord_fixed() +
theme_minimal() +
labs(title = "Hurricane Katrina: Wind and Pressure", x = "Longitude", y = "Latitude")
I also think it would be cool to add a map behind it. Let’s pull one from the rnaturalearth package.
library(rnaturalearth)
library(rnaturalearthdata)
library(sf)
world <- ne_countries(scale = "medium", returnclass = "sf")plot <- ggplot() +
# World landmasses
geom_sf(data = world, fill = "#f0f0f0", color="#8f8d8d", linewidth = 0.3) +
# Map bounds
coord_sf(xlim = c(-95, -75), ylim = c(20, 40), expand = FALSE) +
# Storm path
geom_path(data = katrina, aes(x = long, y = lat),
color = "gray40", linewidth = 1, linetype = "solid") +
# Storm points7
geom_point(
data = katrina,
aes(x = long, y = lat, size = wind, color = pressure),
alpha = 0.8
) +
# Scales
scale_color_gradient(low = "#fee08b", high = "#d73027", name = "Pressure (hPa)") +
scale_size(range = c(2, 15), name = "Wind (knots)", breaks = c(35, 65, 100)) +
# Labels
labs(
title = "Hurricane Katrina (2005)",
x = "Longitude", y = "Latitude"
) +
# Themes
theme(
legend.position = "right",
panel.background = element_rect(fill = "#e6f2ff", color = NA)
)
plot
To animate this over time, you need to add transition_time(time). It may take some time for this code to run on your computer. The animation will show up in the viewer pane on the left, instead of below the code.
plot +
labs(
subtitle = "Time: {frame_time}",
) +
transition_time(katrina$time) +
ease_aes("cubic-in-out")
You need to save this as a .gif file:
anim <- last_plot() %>%
animate(width = 700, height = 500, fps = 5, renderer = gifski_renderer())
anim_save("katrina.gif", anim)You can include this in your file using 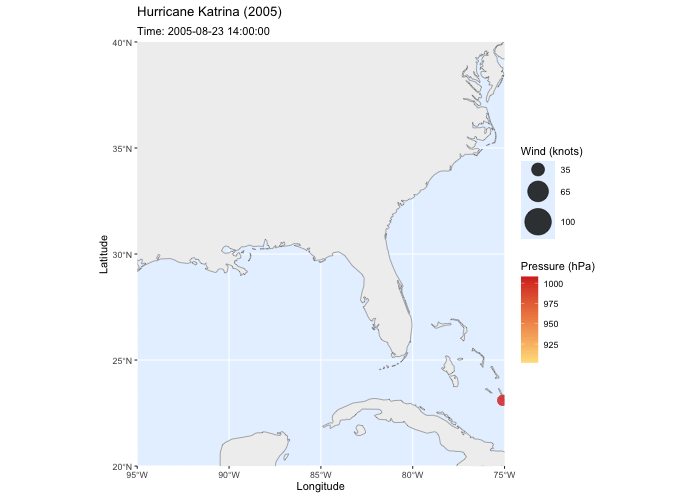 inside plain text.
Note
More ideas:

